Let’s Get Technical
You need to understand the basics of how the market works before I can start to introduce more advanced concepts such as trading methods and systems. So let’s go over the basics.
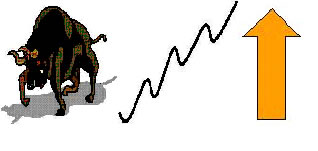
BULL MARKET
The language of the markets can be confusing in the beginning so the following explanations may help.
When the BUYING market is more predominate than the SELLING market here are some expressions commonly used:
BUYING
BUYING LONG
RALLY - UP
GOING UP
HIGHER HIGHS
HIGHER LOWS
NORTH
TRENDING UP DAY
BULL
| Learn
Day Trading Learn how to day trade with the Traders Secret Library. Click here to learn more... Insane
Trading Results! The
Secret Code of Trading |
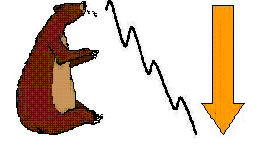
BEAR MARKET SELLING |
SHORT
SELLING SHORT
SHORTING THE MARKET
DOWN
GOING DOWNLOWER LOWS
LOWER HIGHS
BEAR
BEARISH
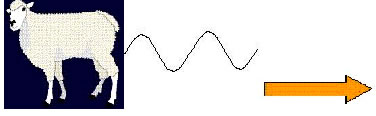
LAMB MARKET
When the market you are looking at is not in a state of massive buying or selling, the market may be basically oscillating from one point to another point and repeating the process.
This may happen for hours or even days. This is often referred to as a lamb market or a trading day. The language for this day might be:
CONSOLIDATION
ACCUMULATION
NOISE
BRACKETING
ON THE FENCE
LAMBS
FLAT
TRADING DAY
Visual Recognition
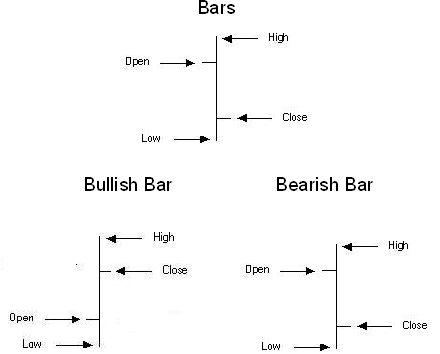
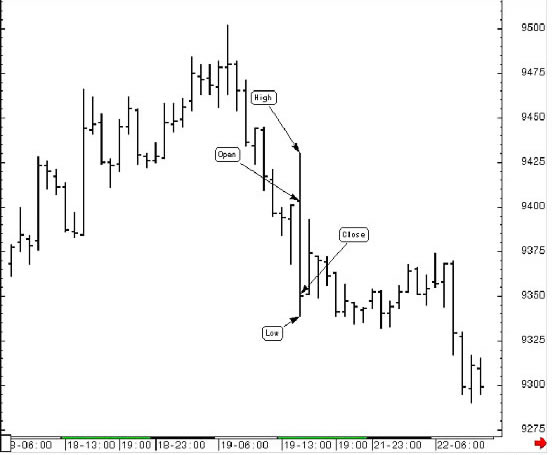
A bar represents one period of time. A means of measuring the duration of buying or selling within the market. The time intervals may be 5 minutes, 10 minutes, 30 minutes, 1 hour, 2 hours, 4 hours, 1 day, 1week, even one minute if desired. You can use any time period you want.
Bar charts are amongst the most widely used charts in the world today and during our e-mail course we will be using them a lot.
Candlesticks
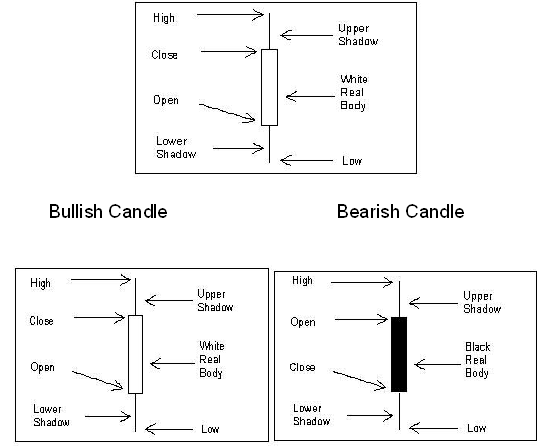
A candlestick represents one period of time. A means of measuring the duration of buying or selling within the market. The time intervals may be 5 minutes, 10 minutes, 30 minutes, 1 hour, 2 hours, 4 hours, 1 day, 1week, even one minute if desired. Just like the bar chart you can use any time period you want.
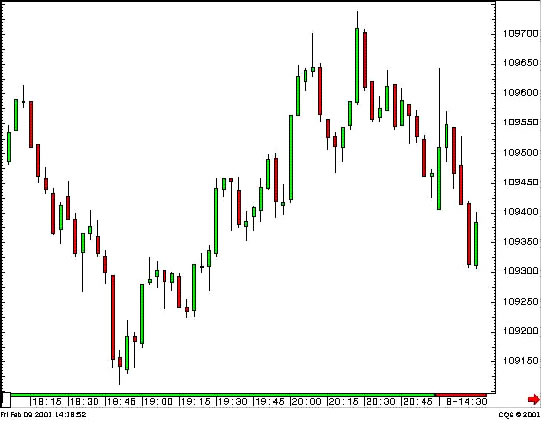
Candlestick Chart
|
Learn
Day Trading Learn how to day trade with the Traders Secret Library. Click here to learn more... Insane
Trading Results!
|
Line Chart
Line charts are made up of plotting the closing prices of given periods. E.g.
Date Price
2nd Feb 02 10,864
5th Feb 02 10,965
6th Feb 02 10,957
7th Feb 02 10,946
A line chart is the simplest type of chart. A line chart's strength comes from its simplicity. It provides an uncluttered, easy to understand view of a prices.
Point & Figure Chart
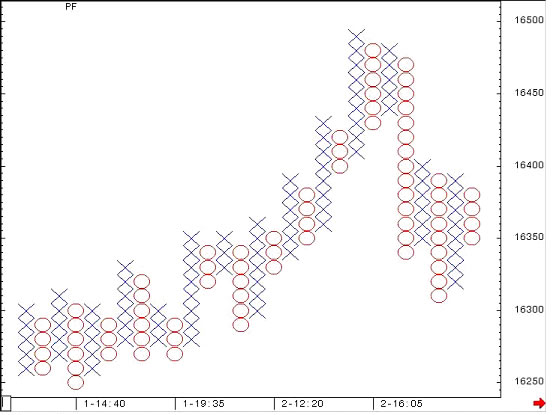
A line or a bar chart is two-dimensional. The vertical spaces measure price. The horizontal spaces measure calendar time, whether hourly, daily, weekly or monthly.
A point-and-figure chart is one-dimensional. Both vertical and horizontal spaces measure price. There is no measurement of arbitrary calendar time. Each successive horizontal space on the chart represents a change of direction in the price, from up to down or from down to up.
Time Periods
Very important: Know where you live!
There is no correct time period to trade, only the time period you feel comfortable in.
If you ask someone to tell you where the trend is in the S&P market they would first have to find out what time period you were talking about. For a daily trader the trend may be up but for an hourly trader the trend may be down.
Lets discuss this a little further. Most of the charts we will be looking at are day charts; that is to say if you are looking at one bar, that encapsulates everything that happened during that day. It would have a high for the day, a low for the day, an open for the day and a close.
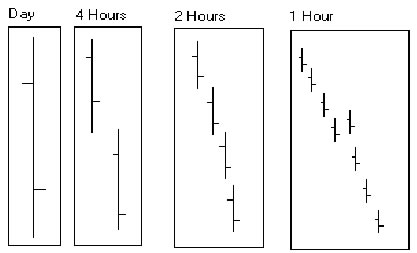
If you were looking at a chart made up of 4-hour bars there would be twice as many bars. Each bar would have it’s own open, high, low and close (OHLC). These may be different from the day OHLC bar as the bar is measuring all the price changes inside that particular time period, in this example, 4 hours.
The same can be said for any other time period whether it is 30 minutes or 1 minute e.g. it would take five 1-minute bars to make up one 5-minute bar.
This is why it’s impossible for someone to tell where the trend is in a particular security unless he knows what time period you are trading.
It is also why if you were looking at a daily bar and noted that the bar closed at e.g. 500 it does not tell you what happened during the day.
If you where trading 5 minute bars you might have watched it rise most of the day and made money only to see it close much lower later in the day.
For the sake of simplicity I recommend you start with daily bars only for the first few months. This will give you plenty of time to make your analysis and plan for the next day’s trade.
I often see people with little or no experience trying to trade 1 minute bars only to find the decision making process is far too much for them as they have to make decisions every minute.
Also worth noting is that there is no one time period that makes more money than another. The reason you would trade a weekly bar as opposed to a 5-minute is purely a matter of choice and circumstance.
One of the secrets of trading is to trade in the time period you feel comfortable in. It is also a function of time and money.
Information, charts or examples contained in this lesson are for illustration and educational purposes only. It should not be considered as advice or a recommendation to buy or sell any security or financial instrument. We do not and cannot offer investment advice. For further information please read our disclaimer.