Trading Theory
Random Walk
The random walk theory dictates that a security's price changes randomly, with no predictable patterns. Now that’s quite a statement but there are number of very respected statisticians who have a very convincing argument to prove it.
It all started in London with a man called Maurice Kendall who presented a paper to the Royal Statistical Society in 1953. The subject of the paper Kendall presented was the behavior of stock and commodity prices.
Ref. M. G. Kendall, ‘’The Analysis Of Economic Time – Series’’ Journal of the Royal Statistical Society (1953)
| Learn
Day Trading Learn how to day trade with the Traders Secret Library. Click here to learn more... Insane
Trading Results! The
Secret Code of Trading |
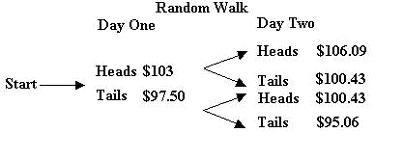
Kendall started out looking for predictable price cycles in stock and commodities prices. The problem was he couldn’t find any. Regardless of how he approached it, the price of a stock was just as likely to go up or down on any given day despite what happened on the previous day. Which is where we get the term Random Walk. Prices seemed to follow a random walk as he observed them. The best way to demonstrate this is with a game. Let say we are going to make a bet on the toss of a coin. You start with $100. We will toss this coin once per day. If it comes up heads you win 3% and if it comes up tails you lose 2.5%. |
At the end of the first day you will either have $103 or $97.50. At the end of the second day we repeat the process so we eventually have something like the table below.
The probability of the coin landing heads or tails is exactly 50%. This is because regardless of how many times the coin is tossed each event is independent. The coin has no memory of what happened the toss before. This means that the results will be totally random.
Kendall's paper implies the same effect in the stock or commodities market. If each day is an independent event then the markets must be random. We shall talk about more probabilities later.
Taking this idea slightly farther, if the markets are random then the history of the price of a stock or commodity has no bearing on the future price. It wouldn’t help to look at charts or data, as each day there would be a 50% chance of the market going up or down.
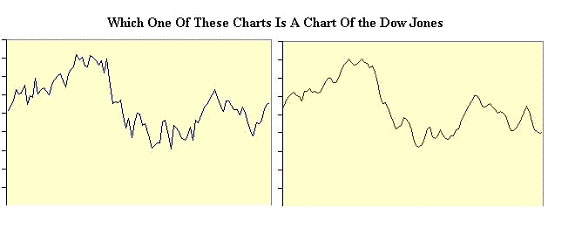
You may be thinking by this stage that this theory is rubbish. I can trade the markets and make money! Try this simple test. Have a look at the two charts below. One is a chart of 100 daily closes of the Dow Jones Industrial Average and the other is a 100 random coin tosses.
Makes you think doesn’t it! If each day in the market were in fact an independent event then it would be impossible for you to make money from it consistently.
We will cover this a little more in the section on probability. By the way, the chart on the left is the chart of the Dow Jones. You see any succession of event's particularly independent events can have an aberrant run. This is what kills the trader.
The Dow Jones Theory And Other Things
Now that we have had a look at the argument against using some form of technical analysis to help gain an advantage in the market lets have a look on the bright side; the argument for using some form of analysis to help make buy and sell decisions in the market.
I have two main arguments of why technical analysis works when applied correctly to trading any financial market and they are simple:
- I know of many professional traders who consistently year after year
make money in the markets. There are also thousands of traders across
the world who make a profit in the markets consistently.
If it where not possible to make money trading because the markets are inherently random, then why do so many traders make money?
-
One of the main reasons I believe technical analysis works is because of the human element. When a market is in a raging bull market, traders know this and can exploit it.
When a major support level is about to break there are normally thousands of traders with some technical training who are aware of this and exploit the situation.
Technical analysis is the science of human behavior. If you are in tune with the market sentiment then you can trade this knowledge effectively.
That is why technical analysis is not an exact science. It is an art. Regardless of the indicator you use what you are really studying is the science of human behavior.
Mr. Charles Dow and Edward Jones
Charles Dow was born 1851 and spent most of his adult life as a newspaperman. His particular area of expertise was reporting on the financial markets.
This eventually brought him to New York where in 1880 he found a job reporting on mining stocks. He was regarded not only as a financial reporter but also as a financial analyst.
It was around this time he met up with Edward D. Jones and
they moved on to form Dow Jones
&Company. The main business of the Dow Jones & Company was delivering
financial information to those who needed it.
The first news sheet of Dow Jones & Company was printed in 1883 and was the forerunner of what we now call ‘’The Wall Street Journal’’.
Dow then joined the New York Stock Exchange in 1885 where he remained a member until 1891. All this is very interesting but why is it important? Well Mr. Dow is considered the father of modern technical analysis and his observations of the markets are considered some of the most important writings relating to technical analysis.
The Dow Theory You will hear a lot about the Dow Theory as you travel through your trading career. Dow himself never actually used the phrase. That came later as analysts began to use the term. I should back up here slightly and mention that in 1884 Dow published his first stock market average of 11 stocks. From the original 11 stocks there were some changes and rearrangements
of the average until finally in 1928 he settled on 30 stocks which
are now know as the industrial average and that is where we get
the term the ‘Dow Jones Industrial Average’. |
Learn
Day Trading Learn how to day trade with the Traders Secret Library. Click here to learn more... Insane
Trading Results! The
Secret Code of Trading |
The actual theory is fairly straightforward to explain and sensible if you take the time to think about it. I shall simplify it slightly, as we have not covered some of the terms yet.
- The market discounts everything. The price you see is the true value of the market. If you are following a particular stock and it is trading at $10 then that is a fair value of that stock. It assumes that all the known information about that stock has been taken into consideration by the market and is reflected in the price. If new information was introduced it would change the price of the stock but it would still be reflected in the price.
- The Market has three main Trends. We are starting to get into some technical expressions here but just bear with me, as we will explain all these terms as we progress.
Dow interpretation of a trend was that each rally high be higher than the previous rally high and each rally low be higher than the previous rally low.
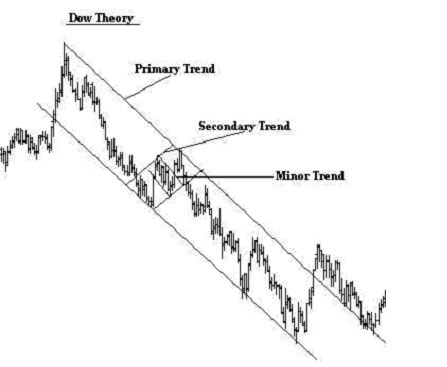
The three trends where a primary, secondary and minor trends. Now this is important because later on as we discuss this it will play a major roll in our analysis.
The primary trend is the main force behind the trend and is like a river flowing in a particular direction. The secondary trend is like tributary to the main trend. It may diverge for a time but eventually it will come back in line with the main river. The minor trend is like a small stream, which runs this way and that, but is headed in the general direction of the river.
The primary trend may take years to come to an end and develops over time. The secondary trend can take anywhere from a few weeks to a few months in duration and the minor trend may be in the opposite direction of the primary trend. Minor trends such as daily trend last a few days or so and are of little significance.
- In addition to the three types of trends, Dow then went on to further qualify the trend by saying that the trend has three phases. An accumulation stage, the public participation stage and finally the distribution stage.
- As the original Dow average was composed of shares from different sectors the next part of the Dow theory was that the average of the different sectors must confirm each other.
- Dow also considered the effect of volume on a trend. He stated that volume should expand in the same direction of the trend.
- The last major part of the theory is the trend should be
assumed to still be in force until there is a definite indication that the direction has in fact changed.
My interpretation of the Dow theory above is very brief as it is beyond this e-mail course to delve to deeply into any one particular subject.
It is also not necessary for what I am trying to achieve and that is to give you a broad idea of how the markets work and some way to trade them. We will get more specific about things later.
The main point I want you to take away from the Dow theory is that there are three types of trends, a primary trend, a secondary trend and minor trends. We can use this in our approach.

Information, charts or examples contained in this lesson
are for illustration and educational purposes only. It should not be considered
as advice or a recommendation to buy or sell any security or financial
instrument. We do not and cannot offer investment advice. For further
information please read our disclaimer.